

The Science of Product Research: Moving Beyond ‘Gut Feeling’ with Data Intelligence
- 2026-06-04
-
 0
0

One line, That is all it took to lose $2,800.
Let me give you a real example:
A former client, Marcus spent six weeks curating product ideas he knew would work. “Portable Blender Bottle,” he told me. “Everyone’s into fitness. I’d buy one.”
He didn’t check sell-through rates. He didn’t spy on competitor stores. He didn’t calculate true sourcing costs. He trusted his gut.
Six weeks later, 300 blender bottles sat dead in a warehouse, and his PayPal balance looked like a countdown clock.
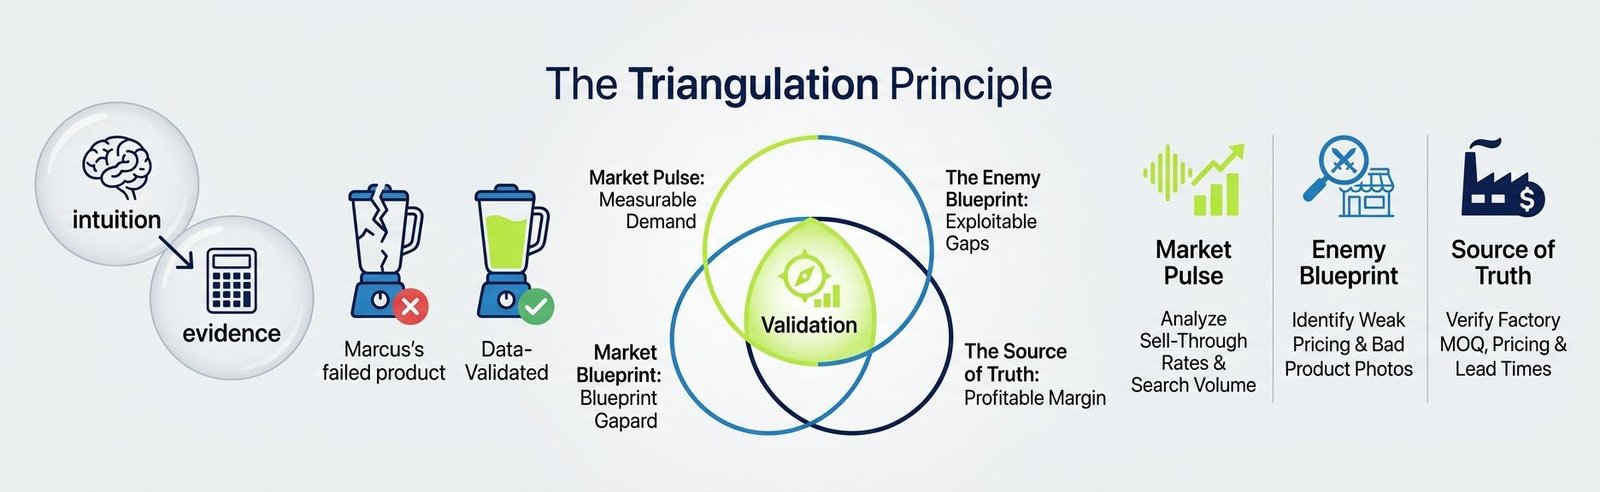
That was the day I stopped believing in intuition-led product research and started building what I now call The Triangulation Principle the core of a larger Profit Anatomy. Think of it as the scientific dissection that reveals whether a product idea has a viable heartbeat, rather than just a familiar face. For anyone still coasting on gut feelings, it’s time for a Profit Pivot: a deliberate shift from guessing to data, from hope to evidence.
Most guides drown you in theory. This one won’t. You’ll learn exactly how to validate product demand across platforms, uncover competitive blind spots, and verify sourcing feasibility before you risk a penny.
The Triangulation Principle rests on three pillars:
-
Market Pulse: Is there real, measurable buyer demand?
-
The Enemy Blueprint: Are the existing sellers leaving an exploitable gap?
-
The Source of Truth: Can the product actually be sourced at a profitable margin?
When all three align, you have a validated opportunity. When they don’t, you walk away. It’s that simple.
Let’s break each pillar down with the exact tools, the real metrics, and the hard-earned lessons that keep you out of Marcus’s seat.
Pillar 1: Market Pulse Is Anyone Actually Buying This?
Marcus's blender bottle felt like a winner because he saw it everywhere. Social media. Fitness forums. A friend's gym bag.
What he never asked was the only question that mattered: Are strangers people who don't know him and don't share his algorithm actually exchanging money for this product right now?
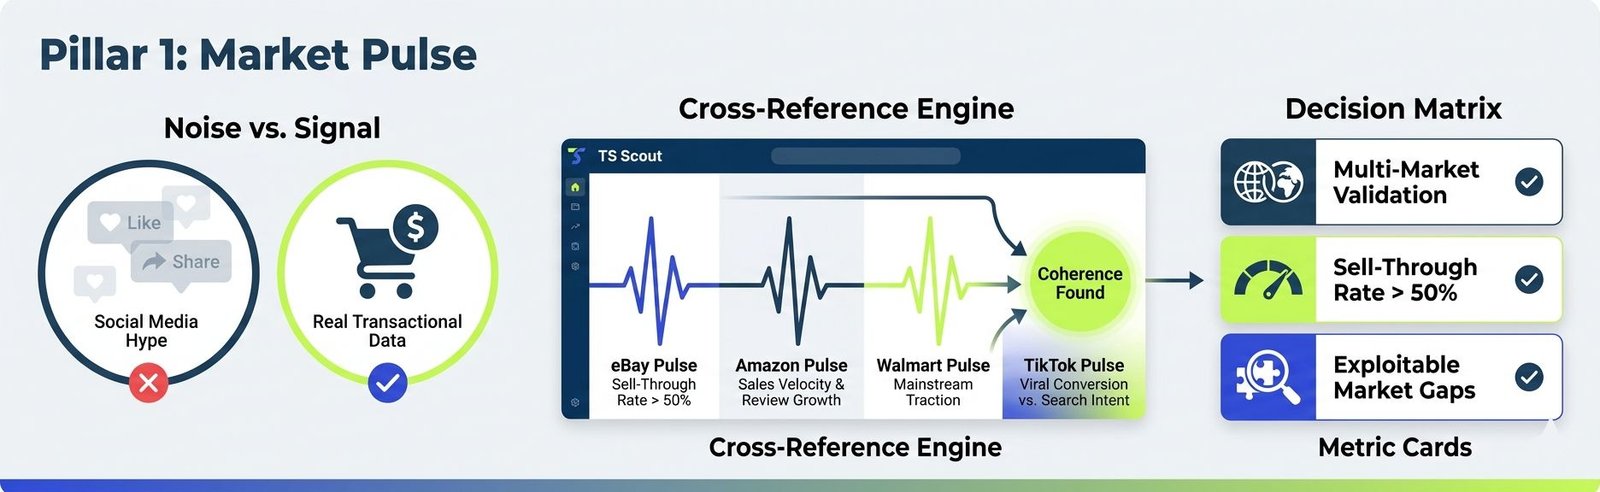
That's what Market Pulse measures. Not interested. Not liked. Not "I'd totally buy that." Real, verifiable demand captured in sales velocity, listing volume, and sell-through rates across independent buying communities.
The Metrics That Actually Count
Most beginners obsess over search volume. That's like judging a restaurant by how many people walked past the door.
The metrics that reveal true Market Pulse are:
-
Sell-Through Rate: Total units sold divided by total active listings. This tells you whether supply is being absorbed by demand or just accumulating.
-
Listing Velocity: How frequently new listings appear. A rising number with flat sales signals saturation. Declining listings with steady sales signals opportunity.
-
Price Distribution: The spread between the highest and lowest sold prices. A tight spread means commoditization. A wide spread means there's room for differentiation.
These numbers are accessible. Not through guesswork through the right tools pointed at the right platform.
Reading Demand Without Asking a Single Shopper
I learned long ago that the market whispers its intentions before it ever shouts. The trick is having the right instruments to pick up the signal.
Within TS Scout, I start with the category, not the item. The eBay Niche Finder gives me a clean aerial view showing which sub-segments inside a broad space like “home fitness” actually maintain a healthy ratio of buyers to sellers. That single step prevents the blunder of selecting a fine product inside a suffocating niche.
From there, I narrow the lens using eBay Product Research, setting the marketplace to the UK or US and filtering by sold listings, not just active ones. This is where the sell-through rate stops being an abstraction and becomes a hard number. A product with 80 monthly sales across 50 listings tells a very different story from one with 20 sales scattered across 300 listings, and that difference is visible in two minutes inside the dashboard.
Before moving on, I always check the eBay Best Items tool not to chase what’s already saturated, but as a reality check. If my target item doesn’t even graze the velocity of what’s already moving, I’m likely building a business on fantasy demand. Together, these three lenses transform a hunch into a reading of what buyers are actually funding with their wallets.
But eBay is only one hemisphere. The market doesn't live there alone.
The Amazon Baseline
For sellers targeting the US and UK, ignoring Amazon is like ignoring gravity. Even if you never list there, Amazon's data reflects the broadest consumer demand signal available.
The Amazon Scanner inside TS Scout surfaces trending and high-demand products directly from the platform. I use it not to copy what's selling, that's a race toward whoever holds the Buy Box but to verify that a product I've spotted elsewhere has mainstream traction. If a kitchen gadget is moving on Amazon at consistent volume, and I can see the pricing tiers and review velocity, I'm no longer guessing whether the category has legs. I'm confirming that the largest marketplace on earth is already pulling orders.
This cross-reference matters enormously. I've seen eBay niches that looked promising until the Amazon Scanner revealed a different story: the identical product selling for half the price with Prime shipping. You can still compete in that scenario, but you'll do it with your eyes open, not with a pricing surprise that arrives after your first shipment.
The Walmart Signal
Walmart Watch adds a layer most sellers completely overlook. The Walmart marketplace, particularly in the US, attracts a demographic that rarely overlaps perfectly with Amazon or eBay. These buyers are often value-conscious, brand-agnostic, and loyal to the platform's ecosystem.
When I see a product trending on Walmart Watch at the same time it's appearing on eBay Best Items and the Amazon Scanner, I'm not looking at a platform-specific anomaly. I'm looking at a product that has crossed into broad, mainstream demand. Three unrelated buying communities, each with distinct habits and expectations, all pointing toward the same item.
That coherence is rare. And it's valuable.
The TikTok Dimension
I saw this principle play out recently with a kitchen item that had caught a mild viral wave. A seller I advised noticed the chatter on social media views climbing, comments piling up but he didn't rush toward the noise. He opened the TikTok Shop Scanner inside TS Scout, let it surface the real sales velocity beneath the hype, and then immediately cross-referenced those numbers against eBay Product Research.
What he found was instructive. The TikTok numbers were loud but the eBay data was quite consistent, unflashy, yet profitable. He didn't compete on price with the TikTok crowd. He positioned his listing for the eBay buyer who searches with intent, not impulse. His sell-through rate outperformed the trend-chasers by a factor of three within the first month. Same product. Different signals. Better outcome. That's the difference between chasing virality and reading the full market picture.
Closing the Market Pulse Assessment
I end every demand scan by checking three conditions. Not perfection that doesn't exist. Coherence.
-
At least two independent marketplaces eBay, Amazon, Walmart, TikTok Shop are reflecting genuine purchase behavior for this product, not just noise.
-
The sell-through rate on the primary marketplace sits above fifty percent, telling me supply hasn't outpaced demand.
-
The top-ranked listings reveal at least one clear gap: an overlooked accessory, a missing variant, a bundle opportunity, a search term nobody has optimized for.
If those three boxes are checked, the product earns its right to the next stage. If any one of them is absent, I walk. Walking away from a bad idea is a form of profit, and it costs nothing.
Pillar 2 is waiting. Knowing there's demand is only half the equation. The other half is knowing whether the sellers already serving that demand have left you a door open or bolted it shut.
Pillar 2: The Enemy Blueprint, Reading the Sellers Who Got There First
Demand is real. The market has confirmed it.
Now comes the part most sellers rush past. Someone already occupies this space. Probably several someone’s, with established listings, accumulated reviews, and customers who return to them by habit.
The instinct is to see that as a barrier. It isn't. It's a blueprint.
Every competitor leaves a visible trail not just of what they sell, but of what they neglect, where they grow complacent, and how much pressure their margins actually carry. You just need to learn to read the marks they don't realize they're making.
What a Store Reveals That a Listing Hides
A product page is a highlight reel. A store is a diary.
When I open a competitor's full eBay presence inside TS Scout, I'm not browsing their catalog with admiration. I'm scanning for the cracks. Which items are actually generating their monthly revenue versus the ones merely populating their storefront? How do they structure their pricing steady across quarters or reactive, with frequent markdowns that suggest they're chasing cash flow? Do they rely on auctions to offload stagnant inventory or maintain fixed prices with confidence?
I watched one seller map a dominant competitor in the home organization niche. The store boasted 2,000 listings and an intimidating feedback score. But the store-level data revealed a quieter truth: forty items were generating over seventy percent of their sales. The remaining 1,960 listings were essentially decorative. That realization shifted the entire strategy. You don't compete with 2,000 items. You compete with forty and specifically, with the variants and gaps those forty don't address.
The Shopify Landscape
Not all competition lives on marketplaces. Some of the most revealing intelligence sits inside independent stores.
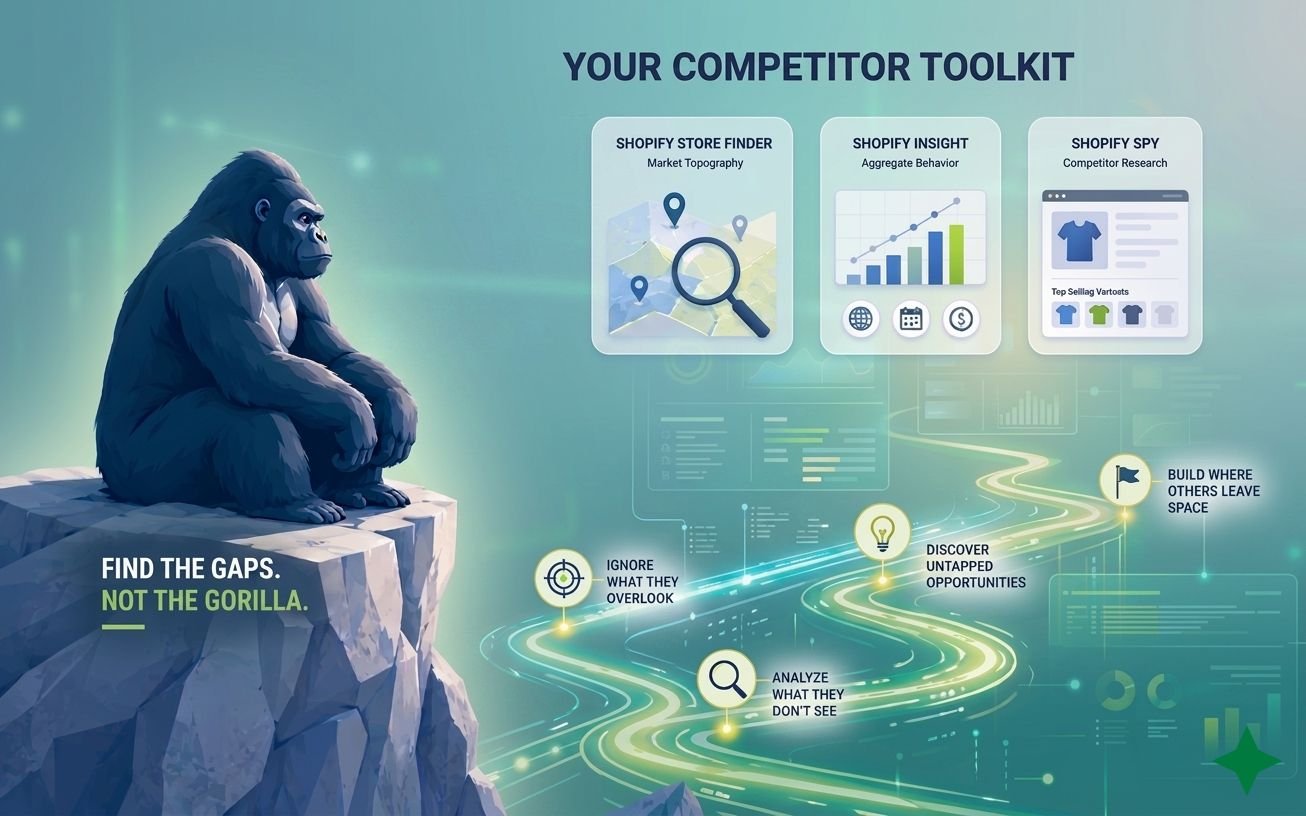
The Shopify Store Finder changes how I approach competitor mapping. Enter a product idea anything from pet grooming kits to standing desk converters and within minutes, the landscape appears. Every Shopify store actively selling in that space, visible and sortable. This isn't just a list. It's a market topography. If the space is populated by a single, highly polished brand with professional photography and a deep blog archive, you're looking at a difficult ascent. If it's scattered among smaller operators with inconsistent branding and thin product descriptions, opportunity exists.
From there, Shopify Insight lets me read the aggregate behavior. Filter by geography, by time period, by price band. I'm not guessing what's selling. I'm watching the numbers accumulate across dozens of stores, seeing which variants actually move and at what price points the volume clusters.
Shopify spy, the competitor research level dive, is where the real blueprint sharpens. I enter a specific store URL and study what emerges. Not just which products they stock, but which variants sell fastest, which categories they're quietly expanding, and most tellingly how aggressively they discount just to capture an email address.
The Discount Signal Nobody Talks About
Discount depth is a stress test hiding in plain sight.
When a Shopify store offers fifteen or twenty percent off just to get a visitor's email, I don't see generosity. I see a brand struggling to differentiate without price concessions. When that discount climbs past twenty-five percent, the signal becomes loud: the value proposition isn't holding, and acquisition costs are being subsidized by margin erosion. A modest ten percent, by contrast, suggests the store has pricing confidence. Customers buy because they perceive distinct value, not because they were bribed.
This single observation, gathered in seconds, tells me more about the difficulty of entering a market than a thousand words of competitor copy ever could. You want to build where pricing confidence exists, not where desperation drives every transaction.
The Gap, Not the Gorilla
Too many newcomers attack the category leader directly. They try to underprice the number-one listing or outspend it on promotion. That's a war of attrition fought uphill.
The smarter route traces what the dominant seller considers too minor to protect. Replacement parts for the product they sell successfully but never support. Color variants they ignore because the volume seems marginal. Use cases their product descriptions never mention, leaving search queries unanswered.
A seller I advised mapped a competitor moving high volumes of a popular kitchen appliance. The appliance itself had hundreds of listings. The compatible cleaning brushes and replacement filters? Twelve listings total, half of them poorly titled and missing basic keyword coverage. He built his entire store around those adjacent items, never once competing on the main product. Twelve months later, his monthly revenue outpaced the seller he'd originally been intimidated by.
Your Action Step
Before you commit to a product, open your competitor toolkit and work through these three questions:
-
Where are the top sellers in this space showing neglect not in overall volume, but in specific variants, accessories, or search terms they haven't optimized for?
-
What does their discounting behavior tell you about margin stability? Are you entering a market with pricing confidence or a race to the bottom?
-
Is there at least one clearly exploitable angle: an accessory gap, a content blind spot, a pricing tier nobody occupies that allows you to enter without directly confronting the largest incumbent?
If the answers reveal genuine whitespace, Pillar 2 is clear. The demand exists. The competition has left a door cracked open.
Now you need to confirm the final pillar: whether the product can actually reach your buyer without destroying your margin. That's Pillar 3: The Source of Truth.
Pillar 3: The Source of Truth, Can You Actually Get It, and at What Price?
So far, the numbers have smiled.
Demand exists across multiple independent buyer pools. The competitors, while present, have left exploitable gaps, an overlooked accessory here, a neglected search term there. For the first time, this product feels less like a gamble and more like a calculated entry.
But none of that matters if you can't source the product reliably, ship it without hemorrhaging cash, and land it in your customer's hands at a price they'll pay and you'll profit from. This is the pillar where supply meets reality, and where many promising ideas quietly collapse.
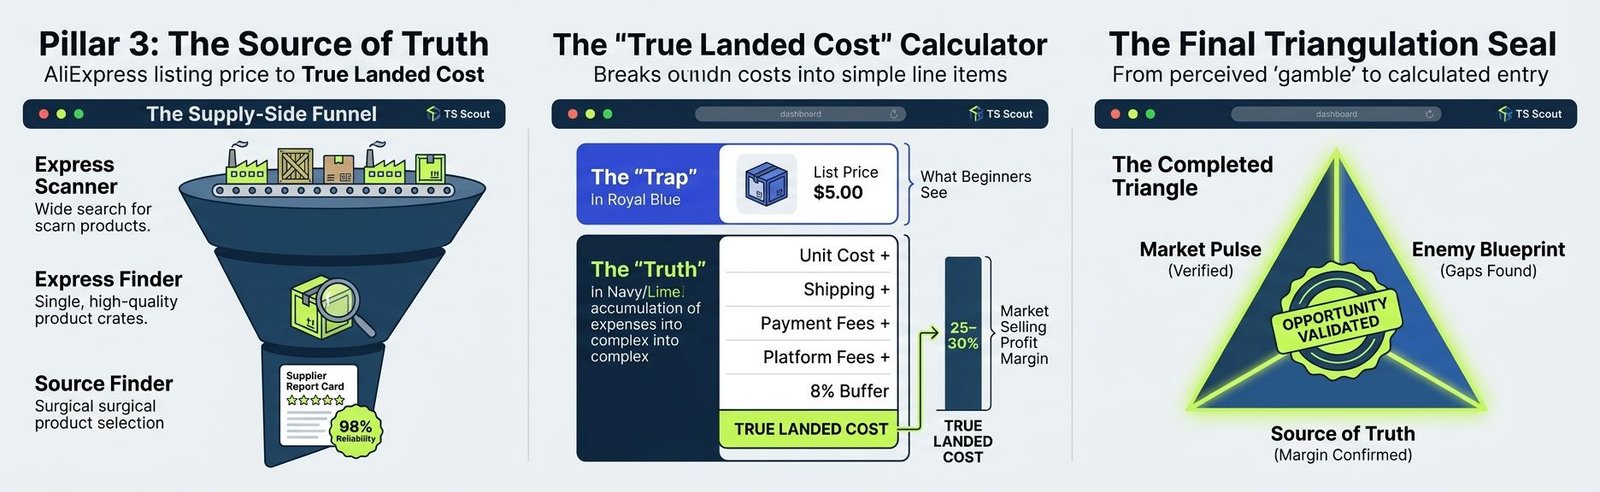
The Source of Truth is not about finding the cheapest AliExpress listing. It's about reverse-engineering the entire supplier landscape, validating reliability before any money leaves your account, and calculating the true cost door to door, tax to tape before you ever type "Dear Supplier."
Three Lenses on the Factory Floor
Within TS Scout, I rely on a quiet workflow that layers the supply side from broad scan to surgical supplier analysis. It saves me from the most common sourcing mistake: falling in love with a storefront before confirming the product category itself has healthy supply dynamics.
|
Step |
How It Works |
The Question It Answers |
|---|---|---|
|
Broad Scan |
Express Scanner highlights trending, high-velocity products moving through AliExpress right now. |
What are factories actually fulfilling? |
|
Narrow Search |
Express Finder searches the specific product with filters for price, sales history, and category. |
Who sells this reliably? |
|
Store Vetting |
Source Finder analyzes an individual supplier by URL—units sold, ratings, pricing consistency. |
Is this supplier legitimate and scalable? |
I move through them in that exact order: broad to narrow, market to vendor. It prevents the error of falling in love with a supplier's storefront before confirming the product category itself has healthy supply dynamics.
Scanning the Landscape
I begin every sourcing assessment with the Express Scanner. I'm not searching for a single item yet; I'm letting the supply side tell me what's flowing. The scanner surfaces products with consistent sales activity items that factories aren't just listing, but actually moving. It's a real-time pulse check on the manufacturing floor.
This step has saved me repeatedly. More than once, I've validated demand on the front end only to discover, through a quick scan, that the supply side is barren, factories have abandoned the item, components are backordered, or the product exists in a single variant that can't be differentiated. That's a dead end, and I'd rather know it in five minutes than fifty days of back-and-forth messages.
Narrowing to the Product
Once I see that the broader category has supply movement, I shift to Express Finder. Here, I search the specific product by name and apply filters ruthlessly. Price range. Category. Sales performance over the last three to six months. I'm filtering out suppliers who list but don't sell, who price so low that quality becomes suspect, or who lack a track record.
This returns a shortlist of suppliers with a pulse. The ones who have actually fulfilled orders, not just posted beautiful photos.
The Store-Level Investigation
Now the surgical work begins. I take the top supplier URLs from that shortlist and plug them into Source Finder.
The report that comes back is more honest than any supplier conversation I'll ever have. Total units sold across all their listings. Pricing consistency over time. Rating distribution across real buyers.
Catalog breadth do they specialize, or are they a general trading company with no supply chain depth? A supplier with 50,000 units moved, stable pricing, and a 98% positive rating across thousands of transactions is not the same as one with 200 units, erratic pricing, and a rating that bounces between four and five stars. The difference is the gap between a business partner and a gamble.
Calculating True Landed Cost
This is the moment where most new sellers get their math wrong. They look at the product price on AliExpress and call that their cost. Then reality arrives with shipping fees, payment processing, customs duties, and a returns buffer they never budgeted for.
Here's the real calculation, every time, in order:
-
Unit Cost: The per-item price at your expected test quantity (not the single-unit price).
-
Shipping per Unit: ePacket, YunExpress, or equivalent, with the actual delivery timeframe verified via Source Finder's shipping history.
-
Payment Processing Fees: Usually 2–3%, but known, not guessed.
-
Platform Fees: eBay, Shopify transaction fees, or Amazon referral fees calculated at your expected selling price.
-
Returns and Defect Buffer: A flat 5–8% set aside for the inevitable damaged items and buyer disputes that every seller absorbs.
-
Landed Cost per Unit: The sum of lines 1 through 5. This is your real cost. Not the AliExpress list price.
Until that final number is lower than the average sold price you uncovered during Market Pulse by a margin that justifies the effort, the product remains unvalidated. Not "maybe." Not "I'll figure it out later." Unvalidated.
The Pillar 3 Checklist
-
Supply side shows active movement: Express Scanner confirms factories are fulfilling this category consistently.
-
Specific products have reliable sellers: Express Finder returns at least 2–3 suppliers with proven sales history, not just listings.
-
Primary supplier passes the Source Finder vet: total units sold, rating stability, and pricing consistency all signal reliability.
-
True landed cost per unit leaves a margin of at least 25–30% against the average platform selling price after all fees and buffers.
If all four conditions hold, the Triangulation is complete. The market has demand. The competition has gaps. The supply chain is real and profitable. What sits in front of you is no longer an idea. It's a validated opportunity.
Conclusion: Your First Triangulation
Marcus lost $2,800 because he stopped feeling. You now carry a framework that doesn't let that happen. Let me walk you through one last product of the kind you'll research tomorrow so you can see the whole sequence fire in order.
A Product Named "Silicone Reusable Food Bags"
I start inside eBay Niche Finder. The sustainable kitchen segment holds a healthy buyer-to-seller ratio. No bloating, no exodus. That's a green light to proceed.
Then I drill into eBay Product Research, filtering to UK solds.
|
Metric |
Value |
Signal |
|---|---|---|
|
Monthly units sold |
1,240 |
Real activity |
|
Active listings |
320 |
Not oversaturated |
|
Sell-through rate |
77% |
Demand absorbing supply |
|
Average sold price |
£11.50 |
Room to position |
Next, I open Amazon Scanner. The same product type appears with a stable Best Sellers Rank in Kitchen & Dining, no dramatic spike, just consistent, boring demand. The TikTok Shop Scanner shows only scattered spikes, none of them sustained in the UK. That's perfect. I'm not chasing a craze. I'm confirming that two independent buying communities are spending money on this item right now.
Pillar 1 verdict: Coherent demand across platforms. Move forward.
The Enemy Blueprint Appears
I open the top eBay seller's store through eBay Competitor Analysis. They're large hundreds of kitchen listings but their pattern is rigid. Every silicone bag listing is a mixed set of 8 or 10. No single-size replacements. No snack-size bundles. Their pricing is stable, so they aren't desperate, but they've clearly decided smaller configurations aren't worth their time.
I pivot to Shopify Store Finder and locate three UK independents selling the same product. I drop one store into Shopify Spy. Beautiful branding, but the same blind spot: full sets only. The pop-up discount is 10% a sign of pricing confidence, not panic. The reviews, however, are a goldmine. Several mention losing the small bag and wanting a single replacement. That's a clear, repeatable gap, written by real buyers.
Pillar 2 verdict: A specific, underserved entry point exists. Move forward.
The Source of Truth (Unchanged)
I open Express Scanner and confirm the supply category is active multiple factories fulfilling volume. Then Express Finder surfaces four suppliers with proven sales history. I vet the top two with Source Finder: Supplier A has 84,000 total units sold, a 4.8 rating, and stable pricing; Supplier B wobbles. I mark A as primary.
The landed cost breakdown:
|
Cost Layer |
Per Unit |
|---|---|
|
Unit cost (test order of 50) |
£2.80 |
|
ePacket shipping |
£0.60 |
|
Payment processing (2.9%) |
£0.10 |
|
eBay fees (12.8% + £0.30) |
£1.30 |
|
Returns/defect buffer (6%) |
£0.20 |
|
True landed cost |
£5.00 |
Against an average sold price of £11.50, that's a 56% margin cushion. Even if I price lower to penetrate, the math protects me.
Pillar 3 verdict: Reliable supply, healthy margin. Pass.
The Moment of Decision
All three pillars stand. The signal is no longer a whisper.
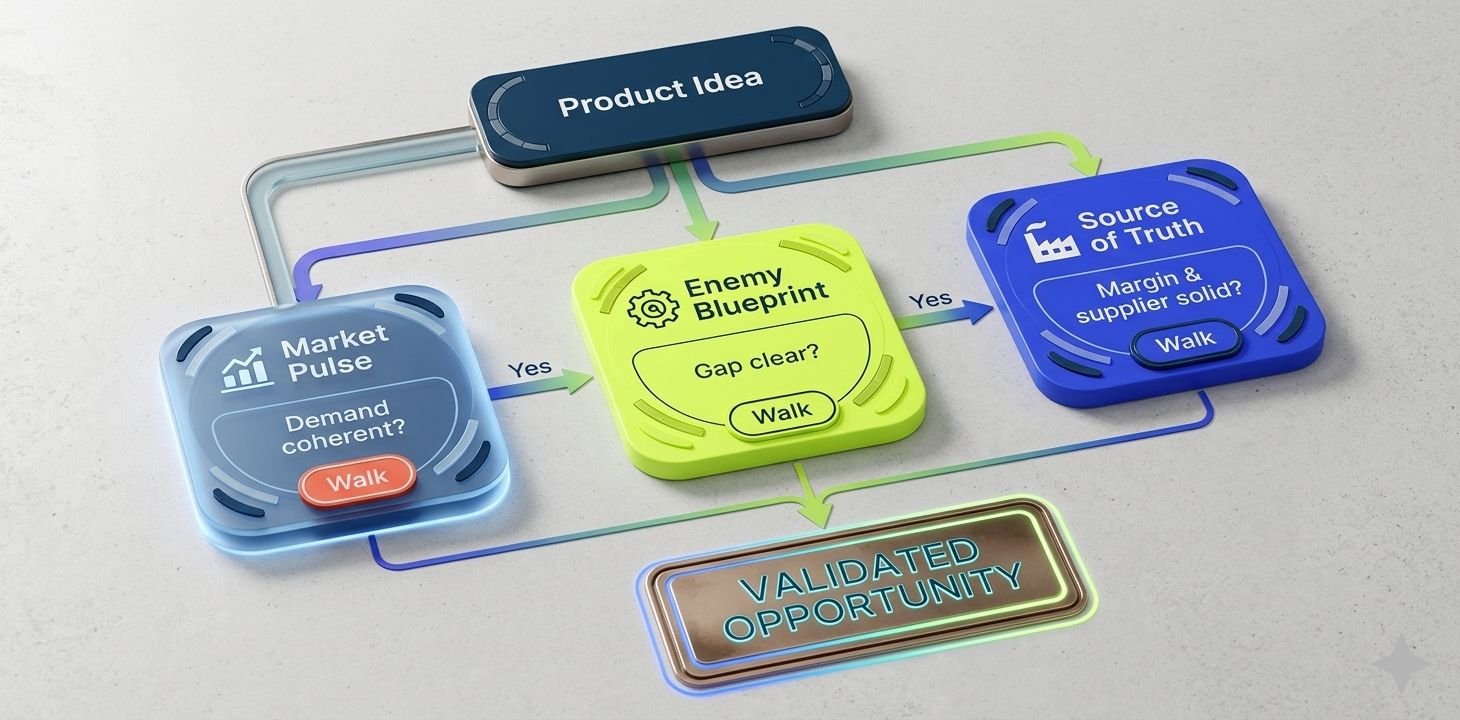
The product in front of you is no longer a gut feeling. It's a business decision with the evidence already attached. That's the difference between Marcus's silence and the seller who wakes up tomorrow, opens a dashboard, and sees a sale they predicted. Start with Pillar 1. Let the market speak first. You'll never have to guess again.
The framework is yours. The tools live inside TS Scout, in a single dashboard no tab‑hopping, no half‑blind guesses.
For one dollar, you get 14 days of full access. That’s not a teaser. That’s enough time to run multiple products through all three pillars, separate the winners from the noise, and walk away with real validated opportunities. No traps. No forgotten subscriptions eating your card. Just a clean trial and an honest answer.
Grab your 14 day trial for $1 now. Let the market speak before you spend a penny more.
Frequently Asked Questions
1. What exactly is the Triangulation Principle?
It's a three‑pillar validation framework that replaces guesswork with data. Before you spend a penny on inventory, you confirm real buyer demand (Market Pulse), identify exploitable competitor gaps (Enemy Blueprint), and verify that you can source the product profitably (Source of Truth). Only when all three pillars agree do you have a validated opportunity.
2. Do I need to use all the platforms you mentioned?
No. The principle is platform‑agnostic. You can start with eBay and Amazon alone, or eBay and TikTok, depending on where your audience shops. The key is cross‑referencing at least two independent buying communities. TS Scout puts all those data sources in one dashboard, so you don't have to jump between tabs.
3. Can I apply this framework if I'm a complete beginner?
Absolutely. The Triangulation Principle is a repeatable checklist, not advanced theory. Each pillar has specific metrics sell‑through rate, listing velocity, landed cost that are visible inside TS Scout without manual calculations. If you can read a number, you can follow the framework.
4. How does TS Scout differ from free methods?
Free methods give you fragments. You might see a TikTok trend but not its eBay sell‑through rate. You might find an AliExpress listing but not the supplier's true sales history. TS Scout consolidates eBay, Shopify, Amazon, AliExpress, Walmart, and TikTok data into a single workspace, saving hours and eliminating the blind spots that gut‑feeling decisions rely on.
5. What if all three pillars don't align?
You walk away. That's the discipline. A "no" from any pillar is a form of profit—it saves you from Marcus's $2,800 mistake. The framework is designed to kill bad ideas early, so you can move on to products that actually have a heartbeat.
6. How long does a full Triangulation take?
Once you're familiar with the tools, you can complete a thorough assessment in under an hour. The Market Pulse scan takes minutes, the competitor blueprint another 15–20 minutes, and the sourcing validation roughly the same. The 14‑day trial gives you ample time to run multiple products through the entire sequence.
7. Do I have to commit to a long subscription to use TS Scout?
Not at all. You can start with a 14‑day full access trial for just $1. That's enough to run several products through all three pillars, validate your first winner, and decide if the toolkit fits your workflow. No traps, no long‑term lock‑in.
like?


Table of Contents
- One line, That is all it took to lose $2,800.
- Pillar 1: Market Pulse Is Anyone Actually Buying This?
- Pillar 2: The Enemy Blueprint, Reading the Sellers Who Got There First
- Pillar 3: The Source of Truth, Can You Actually Get It, and at What Price?
- Conclusion: Your First Triangulation
- Frequently Asked Questions


