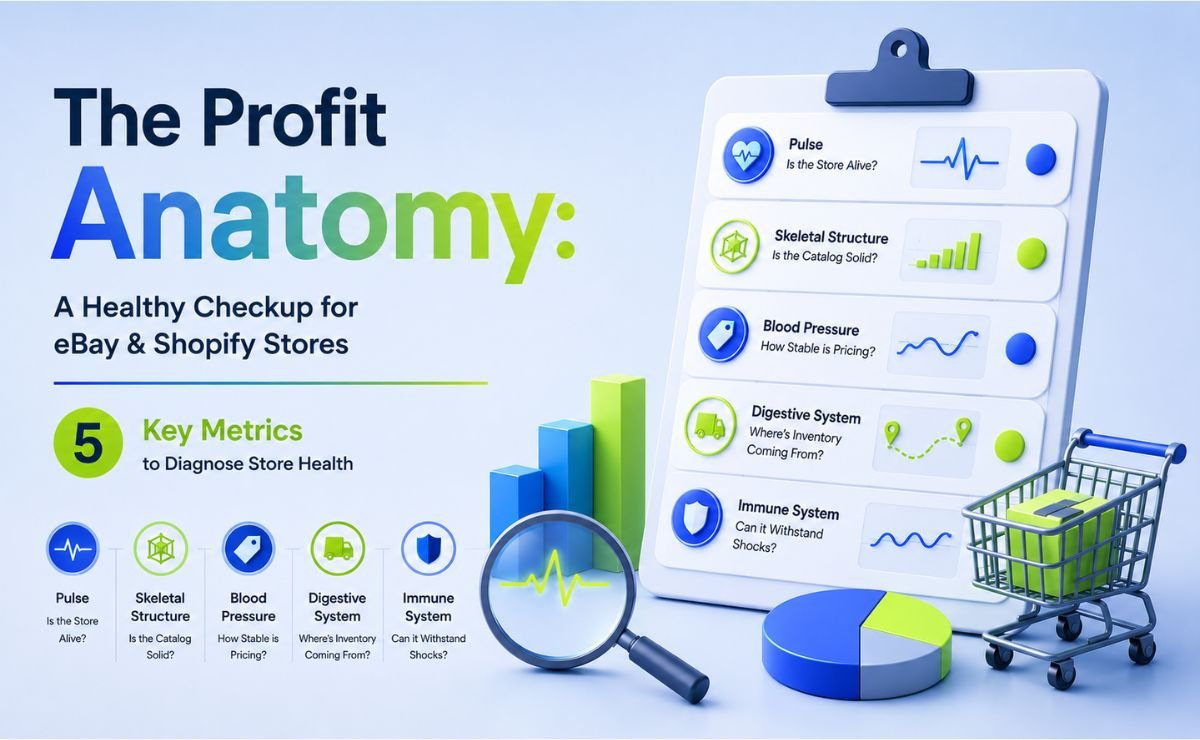
The Profit Anatomy: A Healthy Checkup for eBay And Shopify Stores
- 2026-05-18
-
 0
0
You know that quiet panic. You're staring at a competitor's store that hums along like a healthy heartbeat, while you're still guessing what to list next. The difference isn't magic. It's what sits beneath every listing. We call it The Profit Anatomy.
Most 2026 guides still fight the old war: Shopify vs eBay: Which Platform Wins? They hand you fee tables and call it strategy. That's like checking the temperature of the room while ignoring the patient's vital signs. A real diagnosis doesn't stop at the paint job. It looks at the pulse, the skeleton, the pressure, the digestion, the immune system.
This is the profit pivot, the moment you stop chasing hunches and start reading the data that actually moves money. It's also where the science of product research turns from a hopeful scroll into a precise health scan. No more asking random forums. No more copying what "looks busy." You're about to learn how to reverse engineer exactly why a store thrives, without ever asking the owner.
Whether you're a non-stock operator holding zero inventory or a multi-channel seller bridging platforms, you're about to walk through five vital signs. They'll show you how fast a store breathes, how strong its structure stands, and whether it's truly profitable or just loud.
First checkup: the pulse.
Vital Sign 1: Pulse, Is This Store Even Alive?
Every doctor checks the pulse first. No pulse, no point. In e-commerce, the heartbeat is Sell-Through Rate. Are listings actually selling, or just gathering dust?
Pulse Rate (STR) = (Units Sold in 90 Days ÷ Active Listings) × 100
Below 10% is a flatline. Above 40% is a runner's high, but expect a crowded track. The sweet spot usually sits between.
Instead of scraping sold data manually, eBay Product Research lets you pull up total units sold and active listings for any product in seconds your STR without the mental math. eBay Best Items goes a step further, surfacing the fastest-moving products across eBay, so you never waste time on a heartbeat that's already fading.
On Shopify, where sales figures aren't public, Shopify Insight estimates units sold over a chosen timeframe. No cart tricks, no review-count guessing, just a clean pulse reading from the dashboard.
A Tale of Two Heartbeats (eBay UK)
| Store | Active listings | 90 - Day sales | Pulse ( str) | Diagnosis |
| Garden glow ltd | 8450 | 312 | 3.7% | Flatline, dead stock walking |
| Toolshet clearance | 142 | 1105 | 778% | Runner's high, tiny footprint, massive output |
Same marketplace, opposite health. Toolshed Clearance barely lists, but everything sells. That's not luck, it's a heartbeat worth following.
A strong pulse tells you the store is alive. Next, we check if the skeleton underneath can actually support growth.
Vital Sign 2: Skeletal Structure, Scattered Bones or a Solid Spine?
A pulse proves life. Now check the frame. Some stores are a random pile of bones. Others have a connected skeleton where every product supports the next that's category depth.
The moment you map this structure, you stop seeing products and start seeing gaps in places where you can slide in with a complementary item without competing head-on. eBay Niche Finder – Segment Insight reveals how deep a category runs: demand, competition, and which sub-niches are underserved. On the Shopify side, Shopify Store Finder shows you exactly which stores dominate a niche and how their catalog is built.
| Structure | What looks like | Your move |
| The Puddle | Random items across unrelated categories | Pick one sub-niche and execute better |
| The Trench | Deep focus on a single category | Sell the accessories they ignore |
| The Fortress | An ecosystem of connected products | Offer the consumables they overlook |
They sell the machine. You sell the compatible filters. A scattered skeleton is opportunity. A solid fortress is a free map.
Next: even a strong skeleton fails if the pressure is unstable. Let's check their pricing blood pressure.
Vital Sign 3: Blood Pressure, How Steady Is Their Pricing?
A strong skeleton means nothing if the pressure is all over the place. In a store, blood pressure equals pricing stability. How a seller prices over time tells you whether they're calm and confident or bleeding out.
eBay Competitor Analysis tool pulls up the pricing history of any seller or listing, revealing the pattern instantly. No guesswork, just the chart.
| Pattern | What it looks like | What it means | Your move |
| Stable | Price flat for 90+ days | Confident margin, no panic | Safe to undercut slightly |
| Tides | Rises weekends, dips midweek | Automated repricing software | List at the midweek low on Friday |
| Sawtooth | Sharp 25-40% drops, quick recovery | Cash flow clearance events | Wait for the snapback, then enter |
| Nosedive | Continous small drops, no recovery | Desperate exit race to zero | Stay away entirely |
On Shopify, watch for the "perpetual sale" that strikethrough price that never actually applied. Shopify Spy lets you enter any store URL and instantly view its pricing strategies and sales performance, so you can spot this trick before it costs you. Cross-check the sale price against eBay sold listings. If eBay says £25 and the Shopify store claims "Was £59, now £29," the real market price is £25. They're just a middleman with a prettier page. You can source and list cheaper.
Stable pressure means reliable margin. Erratic pressure means someone's panicking. Either way, the chart tells you before you risk a penny.
Next: even healthy pressure collapses if the digestive system is broken. Let's check their fulfillment.
Vital Sign 4: Digestive System, Where Is the Inventory Really Coming From?
By now, you've used eBay Product Research and Shopify Insight to find a store with a strong pulse and solid skeleton. Now trace the source. A listing claims "Leicester, UK" but the photo shows a US plug that’s a digestive red flag, a supply chain you can't control.
Take the product image or name from that promising competitor straight into Express Finder. If an AliExpress listing matches at a fraction of the price, you've found the origin. Then, open the supplier's store with Source Finder to check ratings, dispatch times, and total units sold. A high-rating supplier with consistent sales has a healthy gut. Patchy feedback and slow dispatch signal trouble.
For fresh opportunities, Express Scanner highlights trending products on AliExpress before they flood the market. That's early detection seeing the pulse before your competitors even check.
| Red Flag | How to detect it |
| Ghost location | Match he competitor's image via Express finder |
| Slow dispatch | Source finder reveals average dispatch time |
| Margin drain | Compare Aliexpress price + epacket cost to competitor's landed price |
When you know the source, you control the health of your own operation.
Next: even a perfect digestive system fails if the immune system is shot. Let's check returns and defects.
Vital Sign 5: Immune System, Is It Fighting Off Defects or Bleeding Out?
All previous vitals collapse if the immune system is weak. In a store, immunity is the Defect Echo Rate how often customers complain or return items.
Defect Echo Rate = (Negative + Neutral Feedback in 30 Days ÷ Estimated Monthly Sales) × 100
| Defect Echo | Diagnosis | What it Means |
| < 0.5% | Strong immunitu | They keep almost everything they earn |
| .5 - 1.5 % | Normal | Manageable friction |
| 1.5 - 3% | Compromised | Systemic issues draining margin |
| > 3% | Bleeding out | Busy outside, broke inside |
The numbers tell you if they're bleeding. The words tell you where. "Arrived late" points to a gut problem. "Not as described" means the listing lies. "Arrived broken" signals fragile stock. Each phrase is a leak you can fix in your own offer.
A competitor with a racing pulse and a weak immune system isn't a threat; they're a cautionary tale. Look for stores with clean feedback, or visible wounds you can heal with a better variant.
The Final Health Report, Your 5-Point Profit Scorecard
| Vital Sign | Score 1 ( weak ) | Score 3 ( Average ) | Score 5 ( Excellent ) |
| Pulse ( velocity ) | STR < 10% | STR 10 - 40% | STR > 40% |
| Skeleton ( Depth ) | Puddle | Trench | Frtress / Moat |
| Blood Pressure ( Pricing ) | Nosedive / Sawtooth | Tides | Flatline |
| Digestion ( fulfillment) | Masked, 10 + days | 3-7 days, clear | 1-2 days, domestic |
| Immunity (Defects) | Echo > 2% | Echo 0.5 - 2% | Echo < 0.5 % |
| Total Score | Diagnosis | Your Move |
| 5 - 10 | Junkyard | Avoid |
| 11 - 18 | Stable | Outperform on one weak metric |
| 19 -25 | Elite | Sell the accessories, no the core |
Every line of this scorecard relies on one thing: data, not hunches. eBay Product Research and eBay Best Items read the pulse. Niche Finder and Shopify Store Finder map the skeleton. eBay Competitor Analysis and Shopify Spy expose the pressure and the immunity gaps. Express Finder and Source Finder trace the digestive chain back to the supplier. One suite, five vitals, zero guesswork.
The charts are live. The patient is waiting. Open your dashboard and start the diagnosis.
TS Scout puts all five vitals eBay, Shopify, and AliExpress tools in one dashboard. No more guessing across tabs.
Try the full suite for $1. 14 days. Every tool. No locks.
If the data doesn't change your next move, cancel and you've lost nothing.
[Start Your $1 Trial, Full Access, 14 Days]
Frequently Asked Questions
1. How long does it take to run a full health check on one store?
About 15 minutes once you know the five vitals. The dashboard does the heavy lifting. Your job is reading the signals, not crunching numbers.
2. What if the store I'm analyzing sells across both eBay and Shopify?
Even better. That gives you two angles on the same skeleton. Compare their eBay sold data against their Shopify pricing. Any gap between them is your entry point.
3. Can I use this framework before I've picked a niche?
That's exactly when it works best. Run the vitals on three or four candidates. The scorecard will eliminate the weak ones before you invest a single hour.
4. What's the most common mistake when reading a competitor's data?
Chasing the loudest store instead of the healthiest one. A high-pulse, low-immunity store looks impressive but leaks profit. The quiet store with clean feedback and stable pricing is the real blueprint.
5. Do these metrics work for physical products only?
No. Digital products, print-on-demand, even service-based stores all leave the same vital signs. Velocity, depth, pricing pressure, fulfillment clarity, and defect echoes apply across models.
6. How often should I re-check a store's vitals?
Markets shift. Re-scan every 30 to 60 days if you're actively selling alongside that competitor. A stable store today might develop a pricing nosedive next quarter. Catch it early.
7. What if the data is incomplete or hidden?
Some stores deliberately hide stock levels or suppress reviews. That's a vital sign in itself. A patient who refuses the stethoscope usually has something to hide. Move to the next candidate.
like?


Table of Contents
- Vital Sign 1: Pulse, Is This Store Even Alive?
- Vital Sign 2: Skeletal Structure, Scattered Bones or a Solid Spine?
- Vital Sign 3: Blood Pressure, How Steady Is Their Pricing?
- Vital Sign 4: Digestive System, Where Is the Inventory Really Coming From?
- Vital Sign 5: Immune System, Is It Fighting Off Defects or Bleeding Out?
- The Final Health Report, Your 5-Point Profit Scorecard
- Frequently Asked Questions